The Truth Behind Your Numbers
How Understanding Margin of Error Boosts Business Success
Confused by Conflicting Survey Results? Here’s What You’re Missing!
You’ve probably seen it before: one survey claims 70% of people love pineapple on pizza, while another insists only 55% are on board. So, who’s telling the truth? Before you throw up your hands in frustration, let’s talk about a little mathematical hero called the Margin of Error.
The Margin of Error isn’t just a fancy term used by statisticians – it’s your secret weapon for understanding how much wiggle room there is in survey results or market research. It helps you determine how accurate those numbers really are and how much confidence you can have in your decisions.
In this article, we’ll break down what the Margin of Error actually means (in plain English), why it’s a game-changer for making informed choices, and how to calculate it like a pro. Whether you’re analyzing customer feedback, conducting polls, or trying to make sense of your own data, understanding the Margin of Error will save you from drawing the wrong conclusions. Ready to decode the mystery? Let’s get started!
What Is the Margin of Error?
Let’s start with the basics: What is the Margin of Error? Simply put, it’s a fancy way of saying, “Here’s how much wiggle room we have in these results.” It’s a number that tells you how much the actual result might differ from the numbers you see in a survey, poll, or study.
Imagine you’re watching the news, and they announce: “Candidate A is projected to win with 52% of the vote, but there’s a Margin of Error of ±3%.” This means Candidate A’s actual support could be as low as 49% or as high as 55%. The Margin of Error is like a safety net for statisticians, letting them say, “Hey, we’re pretty confident about this, but here’s the range where reality might land.”
Why is this important? Because data isn’t perfect. Surveys involve sampling a fraction of the population, and the Margin of Error helps account for the fact that this sample might not perfectly represent everyone. It’s like trying to guess what flavor of ice cream everyone loves by sampling 100 people in your city. The Margin of Error tells you how close your guess is likely to be to the real answer.
In statistical analysis, especially in surveys and polls, the Margin of Error is crucial. It helps businesses, researchers, and decision-makers understand the reliability of their data and avoid making bad calls based on results that might not be as precise as they seem.
Confidence Interval vs. Margin of Error: What’s the Difference?
Now, here’s a question that often trips people up: What’s the difference between a Confidence Interval and the Margin of Error? They’re like two sides of the same coin, but each plays a unique role in understanding data.
- What’s a Confidence Interval?
A Confidence Interval is the range where the true value of something – like public opinion or customer satisfaction – is likely to fall. Think of it as a target zone. If you conduct a survey and find that 60% of people love chocolate ice cream, a Confidence Interval might tell you that the actual percentage is somewhere between 57% and 63%.
- How Does the Margin of Error Fit In?
The Margin of Error determines the size of that range. In the example above, the ±3% is your Margin of Error, which tells you how far the true value might deviate from the reported percentage. Essentially, the Margin of Error is what makes up the boundaries of the Confidence Interval.
- Let’s Visualize It:
Imagine a dartboard. The Confidence Interval is the entire bullseye area, while the Margin of Error is the size of the circle you’re aiming for. A smaller Margin of Error means a tighter, more accurate bullseye.
- Why It Matters:
If you’re making decisions based on data, the Confidence Interval tells you how confident you can be in those decisions. For example, if a product survey shows 80% satisfaction with a Confidence Interval of ±1%, you can feel more assured than if the Margin of Error were ±10%, leaving a lot of room for uncertainty.
So, while the Confidence Interval gives you the range, the Margin of Error defines how wide or narrow that range is. Together, they’re your data’s dynamic duo, keeping your insights sharp and reliable!
- Formula for Margin of Error (Very Simple)
Let’s keep it simple: the formula for the Margin of Error (MOE) is:
Margin of Error = Critical Value × Standard Error
Now, let’s break this down into bite-sized pieces:
1. Critical Value
This is a multiplier based on the confidence level you choose (like 90%, 95%, or 99%). It reflects how certain you want to be about your results. The higher the confidence level, the larger the Critical Value. For example:
– At 95% confidence, the Critical Value (Z-score) is approximately 1.96.
2. Standard Error
The Standard Error measures how much variation there is in your data. It’s influenced by the size of your sample – the larger your sample, the smaller the Standard Error, and the more precise your results.
Example Calculation
Imagine you survey 400 people, and 60% say they prefer tea over coffee. You want a 95% confidence level.
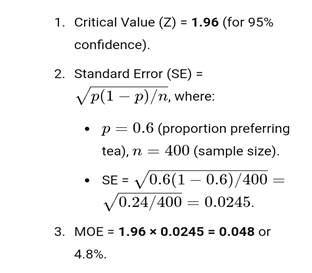
So, your survey results would be reported as 60% ± 4.8%.
The Extended Margin of Error Formula
When the population variance is unknown or you’re working with proportions, use this extended formula:
MOE = Z × √[p(1-p)/n]
Here’s how it works:
1. Z-Score (Z)
The Z-score is tied to your confidence level, just like in the simple formula:
– 90% confidence: Z = 1.645
– 95% confidence: Z = 1.96
– 99% confidence: Z = 2.576
2. Sample Proportion (p)
This is the percentage or fraction of your sample that represents the characteristic you’re studying. For example, if 60% of respondents prefer tea, \(p = 0.6\).
3. Sample Size (n)
The number of people surveyed. A larger \(n\) decreases the MOE, improving precision.
Example: Market Research Scenario
A company surveys 1,000 people to find out how many prefer their new product. Let’s say 70% (or \(p = 0.7\)) gave a thumbs-up. They want a 95% confidence level.
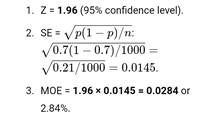
Final Report:
The survey suggests 70% ± 2.84% of people like the product. This means the true value is likely between 67.16% and 72.84%.
This extended formula is particularly useful in market research, polling, and decision-making where precision is key!
2 Easy Steps to Calculate Margin of Error
Calculating the Margin of Error might sound intimidating, but it’s actually quite simple if you follow these two easy steps:
Step 1: Calculate the Standard Error (SE)
The Standard Error shows how much your sample results might vary from the true population. Use this formula:
Standard Error = √[p(1-p)/n]
Where:
- p = sample proportion (e.g., 0.6 for 60%).
- n = sample size.
Step 2: Multiply by the Z-Score
The Z-score depends on the confidence level:
- – 90% confidence: Z = 1.645
- – 95% confidence: Z = 1.96
- – 99% confidence: Z = 2.576
Multiply the Standard Error by the Z-score to calculate the Margin of Error (MOE):
MOE = Z × SE
Example: Customer Satisfaction Survey
You surveyed 500 customers, and 80% (or \(p = 0.8\)) said they are satisfied with your service. You want to calculate the Margin of Error for a 95% confidence level.
Step 1: Calculate the Standard Error (SE)
SE= √p(1−p)/n
SE= √0.8(1−0.8)/500 = √0.16/500 =√ 0.00032 =0.0179
Step 2: Multiply by the Z-score
At 95% confidence, Z = 1.96.
MOE=1.96×0.0179=0.0351 or 3.51%
Final Result:
The survey shows 80% ± 3.51% customer satisfaction, meaning the true satisfaction rate is likely between 76.49% and 83.51%.
These two steps make calculating the Margin of Error straightforward and reliable for real-world applications!
Comparing Both Margin of Error Formulas
Choosing the right Margin of Error formula depends on your data and goals. Let’s break it down:
Simple Formula
Formula: Margin of Error = Critical Value × Standard Error
- – Best for: Small data sets with known population data.
- – Key Components: Confidence level (Z-score) and standard deviation or error.
- – Example Use Case: Measuring variance in a small test group of employees.
Extended Formula
Formula: MOE = Z × √[p(1-p)/n]
- – Best for: Large data sets or when population variance is unknown.
- – Key Components: Z-score, sample proportion (\(p\)), and sample size (\(n\)).
- – Example Use Case: Conducting market research or public opinion polls.
The simple formula works for smaller, controlled scenarios, while the extended formula is ideal for larger or less predictable datasets. Both ensure your data-driven decisions are backed by confidence and precision!
How Does Confidence Level Relate to Margin of Error?
The Confidence Level and Margin of Error are like two sides of the same coin – they work together to tell you how reliable your survey results are. The higher the confidence level, the more certain you are that the results reflect the true population. But here’s the catch: a higher confidence level also comes with a larger Margin of Error, making your results less precise.
- What’s the Relationship?
Think of it this way: if you want to be 95% confident in your data, you’re willing to accept a certain amount of error, say ±3%. But if you want to crank up the confidence to 99%, you need a wider safety net – so the Margin of Error increases to, say, ±4.5%.
- Example
Imagine a company surveys 1,000 people to see if they like a new product. Here’s what the results might look like:
– 95% Confidence Level: 60% ± 3% (True value is between 57% and 63%).
– 99% Confidence Level: 60% ± 4.5% (True value is between 55.5% and 64.5%).
In both cases, you’re confident, but the higher the confidence level, the more you’re hedging your bets – resulting in a wider range of possible values.
- Why Does This Happen?
A higher confidence level demands more certainty, which means accounting for more variability in your data. This ensures that your results are accurate but comes at the cost of precision.
- Visualizing the Impact
Picture a bell curve. At 95% confidence, you’re focusing on a narrower section of the curve, which translates to a smaller Margin of Error. At 99%, you’re covering a broader area, which increases the Margin of Error. A graph comparing these levels would clearly show how the range widens as confidence increases.
Boost Your Profit with Market Research Surveys
Accurate market research is your secret weapon for business growth. By understanding the Margin of Error, you can confidently interpret survey results and make data-driven decisions that boost profits.
For example, let’s say you’re launching a new product and survey your target audience. The results show that 60% of respondents are interested, with a Margin of Error of ±3% at 95% confidence. This means the true interest level is likely between 57% and 63% – a solid range to justify launching the product.
If your Margin of Error were larger, say ±10%, the range (50%-70%) would be too uncertain, making it harder to plan effectively. By ensuring your surveys have a small Margin of Error, you reduce uncertainty and can fine-tune everything from pricing to marketing strategies.
For small businesses, this precision can be a game-changer. Understanding customer preferences, testing new ideas, or gauging satisfaction becomes easier and more reliable, leading to better decisions and higher profitability.
Quick Tip: Use tools like Vantazo to streamline survey analysis and track your Margin of Error automatically. With accurate insights, you can minimize risks and maximize your market impact.